RBA charts show borrowers and brokers are still well-positioned despite recent lending changes
.gif)
RBA charts show borrowers and brokers are still well-positioned despite recent lending changes
Interest rates remain at historic lows and house prices are still reaching historic highs, the RBA’s latest chart pack has shown.
Chart packs are regularly published by the RBA and show long-term data on interest rates, household finances, house prices and variety of other data. Unlike some other charts, the RBA’s data goes back in the 1990s, providing a long-term view of the current market and brokers’ prospects.
5 graphs from June’s chart packs show how, relatively speaking, brokers and borrowers remain well-positioned in the current market.
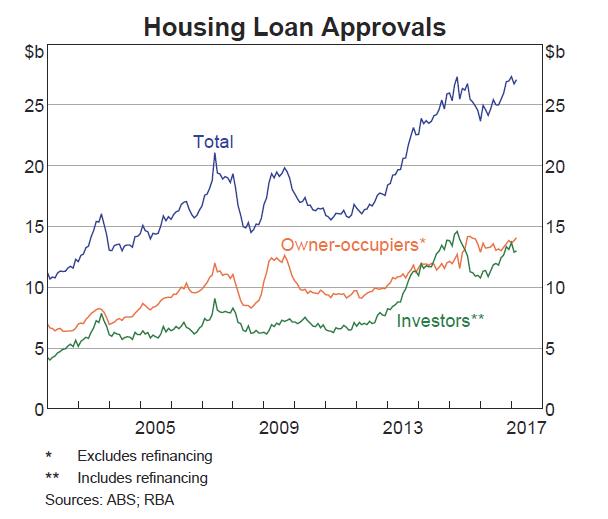
1. Loan approvals
Even with growth caps on investor and now interest-only lending, loan approvals remain close to record highs. Deloitte’s latest Australian Mortgage Report did predict settlements would fall in 2017, however.
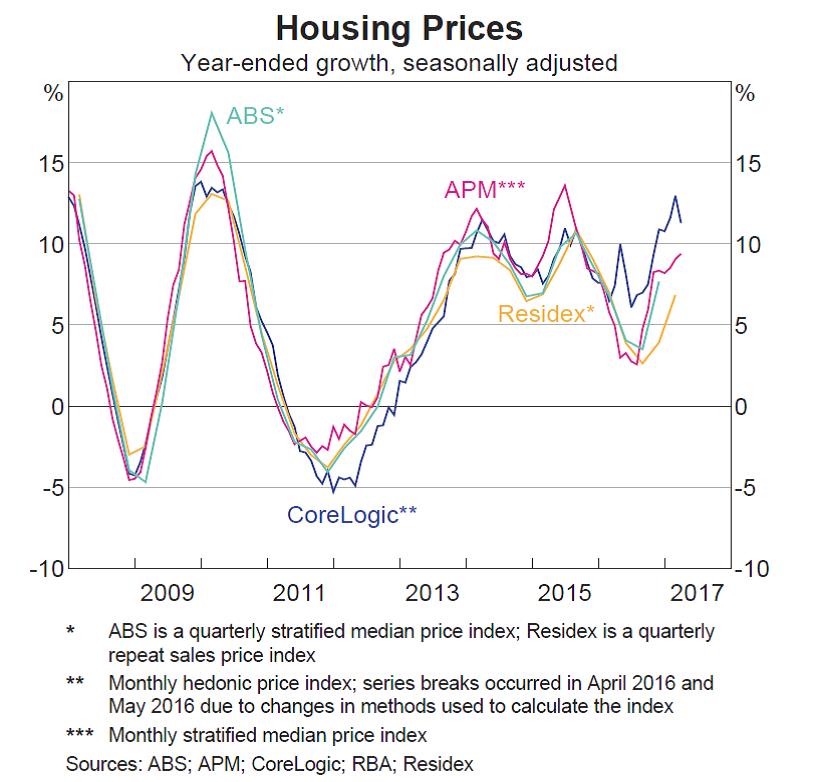
2. House Prices
Corelogic’s Home Value Index has recently been showing falling prices in Sydney and other cities – but not all measures agree. Bear in mind the RBA’s chart records growth, not actual house prices; prices are still rising when you look at the year-ended figures.
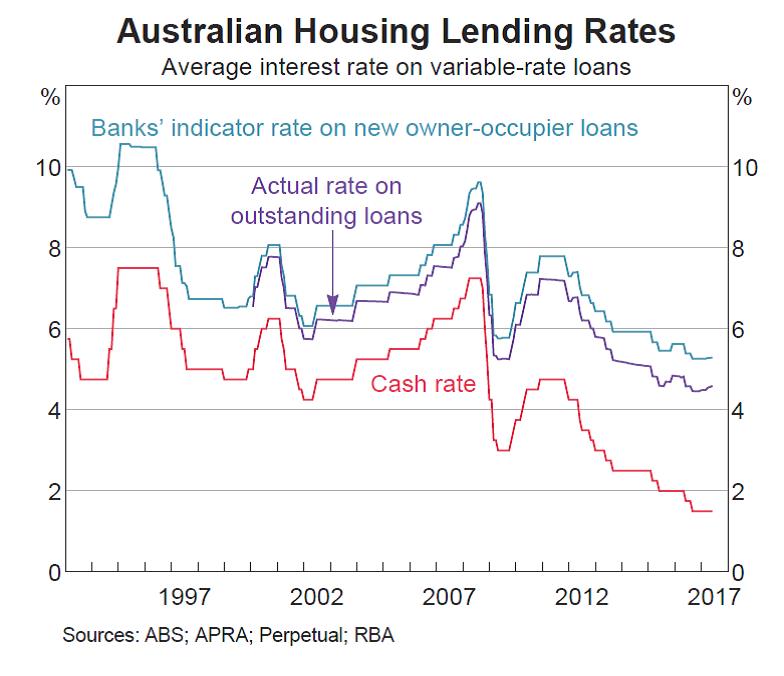
3. Variable Interest Rates
Actual interest rates don’t appear to be falling anymore – but nevertheless remain at a historic low. Also of interest is the movement in bank interest rates compared to the stability of the actual cash rate, demonstrating how little resemblance they bear to each other.
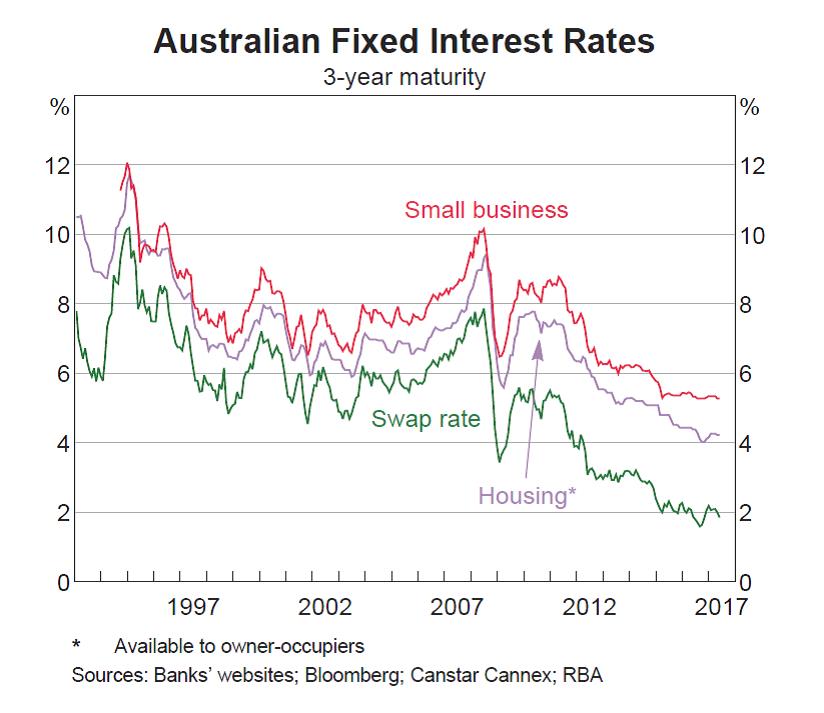
4. Fixed interest rates
Fixed rates jumped a little in late 2016 but remain relatively low and are actually falling:
5. Debt and repayments
Positively for borrowers, low-interest rates are keeping repayments manageable; affordability is defined by the % of income going to repayments. However, the level of house prices remains the debt held by consumers is now enormous, explaining APRA’s increasing interference in the market.
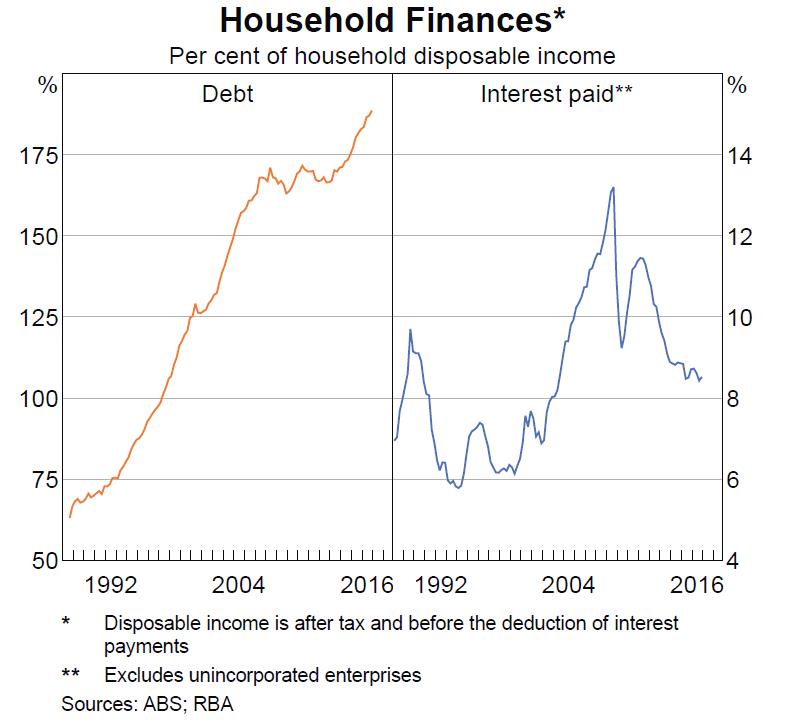
Source for all: Reserve Bank of Australia, The Australian Economy and Financial Markets Chart Pack, June 2017
Interest rates remain at historic lows and house prices are still reaching historic highs, the RBA’s latest chart pack has shown.
Chart packs are regularly published by the RBA and show long-term data on interest rates, household finances, house prices and variety of other data. Unlike some other charts, the RBA’s data goes back in the 1990s, providing a long-term view of the current market and brokers’ prospects.
5 graphs from June’s chart packs show how, relatively speaking, brokers and borrowers remain well-positioned in the current market.
1. Loan approvals
Even with growth caps on investor and now interest-only lending, loan approvals remain close to record highs. Deloitte’s latest Australian Mortgage Report did predict settlements would fall in 2017, however.
2. House Prices
Corelogic’s Home Value Index has recently been showing falling prices in Sydney and other cities – but not all measures agree. Bear in mind the RBA’s chart records growth, not actual house prices; prices are still rising when you look at the year-ended figures.
3. Variable Interest Rates
Actual interest rates don’t appear to be falling anymore – but nevertheless remain at a historic low. Also of interest is the movement in bank interest rates compared to the stability of the actual cash rate, demonstrating how little resemblance they bear to each other.
4. Fixed interest rates
Fixed rates jumped a little in late 2016 but remain relatively low and are actually falling:
5. Debt and repayments
Positively for borrowers, low-interest rates are keeping repayments manageable; affordability is defined by the % of income going to repayments. However, the level of house prices remains the debt held by consumers is now enormous, explaining APRA’s increasing interference in the market.
Source for all: Reserve Bank of Australia, The Australian Economy and Financial Markets Chart Pack, June 2017