CoreLogic has released an extensive report on what the average investor actually looks like, as property investors make a come back
If you've been following the negative gearing debate for a while, you may have got used to the lack of real data informing the arguments on both sides.
The data behind negative gearing and property investors more widely is elusive, requiring the use of several sources: the ATO, the ABS and house price indices, to name but a few. Luckily CoreLogic has knitted together this data into a single report: Profile of the Australian Residential Property Investor, released in June 2016.
For anyone in the property industry, this report is nothing less than essential reading. While much of it addresses the debate over negative gearing, it also features a profile of the average property investor, including break downs of capital city areas, which brokers can use to identify potential investor clients and target their marketing accordingly.
The CoreLogic report also looks at longer-term trends, most of all the decline in yields, driven by increasing property values and falling rents, which reduced by 0.2% over the past year.
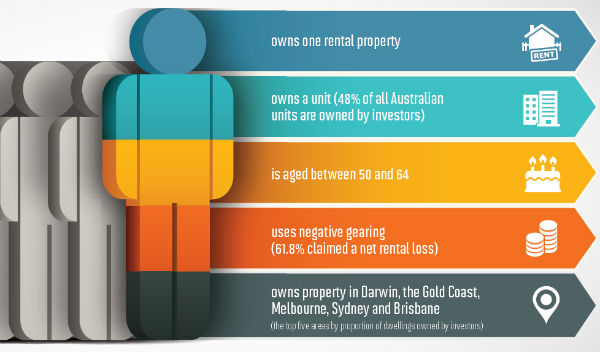
NEGATIVE GEARING
CoreLogic’s report used ATO data to narrow down the property investors who are most likely to utilise negative gearing (as evidenced by claiming a net rental loss). The typical ‘negative gearer’:
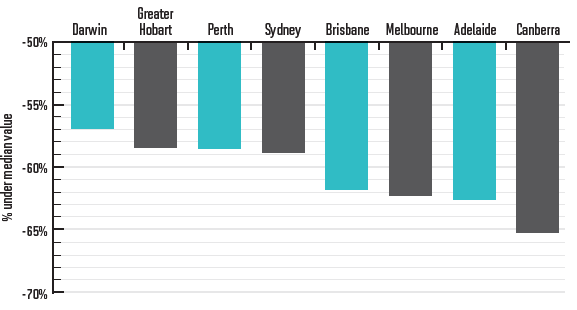
VALUE OF INVESTOR PROPERTIES
According to CoreLogic, the average investor-owned property is likely to be substantially cheaper than the average owner-occupied property. Comparing investor property values with the median price in Australia’s capital cities produces interesting results.
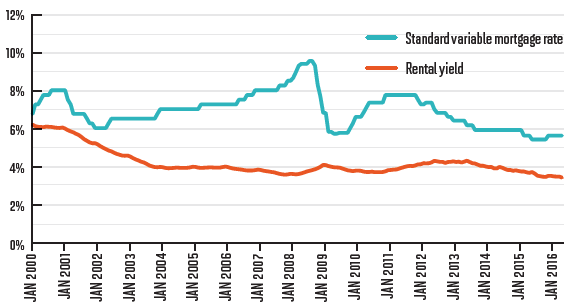
RENTAL YIELDS CONTINUE TO FALL
Rental yields are continuing to fall. The reason is likely to be dwelling values, which increased by 29.4% across Australia’s combined metro regions over the last five years, partially driven by the falling average standard variable mortgage rate.
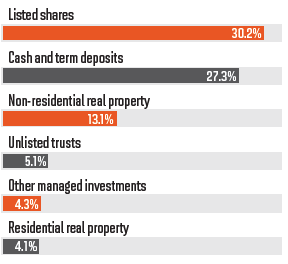
SMSFS AND INVESTING
$24.4bn worth of residential property assets are held in self-managed super funds, representing a 67.1% increase from June 2011 to March 2016, according to the ATO. Overall, however, residential property still represents a small share of SMSF investments.
The data behind negative gearing and property investors more widely is elusive, requiring the use of several sources: the ATO, the ABS and house price indices, to name but a few. Luckily CoreLogic has knitted together this data into a single report: Profile of the Australian Residential Property Investor, released in June 2016.
For anyone in the property industry, this report is nothing less than essential reading. While much of it addresses the debate over negative gearing, it also features a profile of the average property investor, including break downs of capital city areas, which brokers can use to identify potential investor clients and target their marketing accordingly.
The CoreLogic report also looks at longer-term trends, most of all the decline in yields, driven by increasing property values and falling rents, which reduced by 0.2% over the past year.
NEGATIVE GEARING
CoreLogic’s report used ATO data to narrow down the property investors who are most likely to utilise negative gearing (as evidenced by claiming a net rental loss). The typical ‘negative gearer’:
VALUE OF INVESTOR PROPERTIES
According to CoreLogic, the average investor-owned property is likely to be substantially cheaper than the average owner-occupied property. Comparing investor property values with the median price in Australia’s capital cities produces interesting results.
RENTAL YIELDS CONTINUE TO FALL
Rental yields are continuing to fall. The reason is likely to be dwelling values, which increased by 29.4% across Australia’s combined metro regions over the last five years, partially driven by the falling average standard variable mortgage rate.
SMSFS AND INVESTING
$24.4bn worth of residential property assets are held in self-managed super funds, representing a 67.1% increase from June 2011 to March 2016, according to the ATO. Overall, however, residential property still represents a small share of SMSF investments.